Matplotlib Axes Aligner

Overview
Matplotlib axes aligner (mpl_axes_aligner) package contains the modules which adjust the plotting range of matplotlib.axes.Axes objects to align their origins.
mpl_axes_aligner.shiftexpands or shifts the plotting range of a matplotlib axis to align the origin with the given position.mpl_axes_aligner.alignadjust the plotting range of two matplotlib axes to align their origins with the given position.
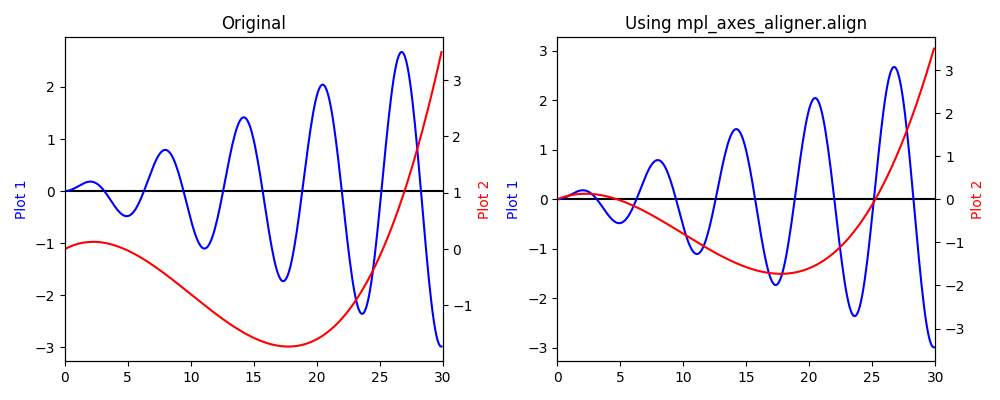
When you want to align the y = 0 of plot 1 and plot 2 with the center of the figure, it is done by introducing the function mpl_axes_aligner.align.yaxes().
import numpy as np
import matplotlib.pyplot as plt
from mpl_axes_aligner import align

x = np.arange(0.0, 30, 0.1)
y1 = 0.1 * x * np.sin(x)
y2 = 0.001*x**3 - 0.03*x**2 + 0.12*x

fig = plt.figure()
ax1 = fig.add_subplot(111)
ax2 = ax1.twinx()

ax1.plot(x, y1, color='blue', label='Plot 1')
ax2.plot(x, y2, color='red', label='Plot 2')

# Align y = 0 of ax1 and ax2 with the center of figure.
align.yaxes(ax1, 0, ax2, 0, 0.5)

plt.show()