Shift module usage
mpl_axes_aligner.shift expands or shifts the plotting range of a matplotlib axis to align the origin with the given position.
shift.xasis()for x-axisshift.yasis()for y-axis
Shift y axis
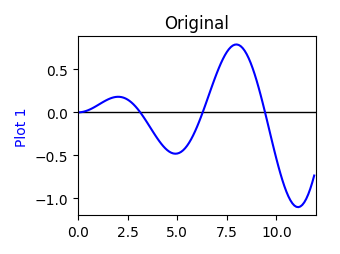
In this section, shift.yaxis() is demonstrated by using the following plot:
import numpy as np
import matplotlib.pyplot as plt

x = np.arange(0.0, 12, 0.1)
y = 0.1 * x * np.sin(x)

fig = plt.figure()
ax = fig.add_subplot(111)

ax.plot(x, y, color='blue', label='plot 1')
ax.hlines(y=0, xmin=0, xmax=30, linewidth=1)

ax.set_ylabel('Plot 1', color='blue')
ax.set_xlim(0.0, 12.0)

plt.tight_layout()
plt.show()
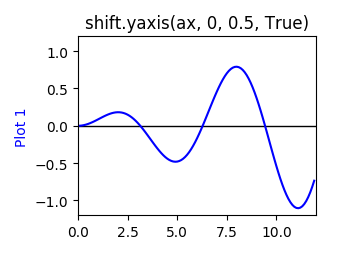
When you want to shift y = 0 to the center of figure, use shift.yaxis():
import numpy as np
import matplotlib.pyplot as plt
from mpl_axes_aligner import shift

x = np.arange(0.0, 12, 0.1)
y = 0.1 * x * np.sin(x)

fig = plt.figure()
ax = fig.add_subplot(111)

ax.plot(x, y, color='blue', label='plot 1')
ax.hlines(y=0, xmin=0, xmax=30, linewidth=1)

ax.set_ylabel('Plot 1', color='blue')
ax.set_xlim(0.0, 12.0)

# Adjust the plotting range of two y axes
org = 0.0  # Origin
pos = 0.5  # Position the origins is aligned
expand = True  # Switch the aligning method
shift.yaxis(ax, org, pos, expand)

plt.tight_layout()
plt.show()
Argument 1: Axis (ax)
The first argument of shift.yaxis() (ax) is the matplotlib.axes.Axes object which you want to change.
Argument 2: Origins (org)
The second argument of shift.yaxis() (org) is the origin which you want to align.
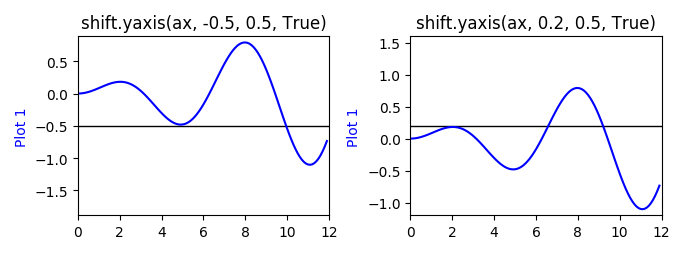
Argument 3: Relative position (pos)
The third argument of shift.yaxis() (pos) is the relative position which the origin is aligned.
When expand = True, pos should satisfy the condition \(0 < pos < 1\), otherwise, pos should satisfy the condition \(0 \le pos \le 1\).
When pos is nearly 0, the origin is shifted to bottom, when pos is nearly 1, on the other hand, the origin is shifted to top.
When pos is 0.5, the origin is aligned at the center of figure.
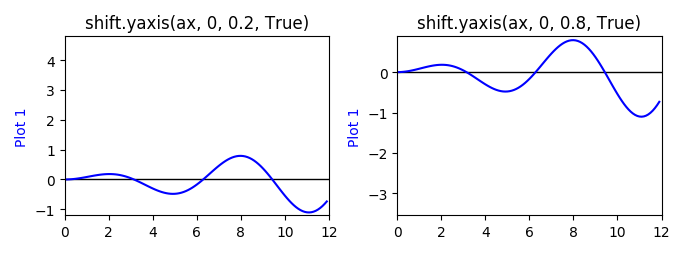
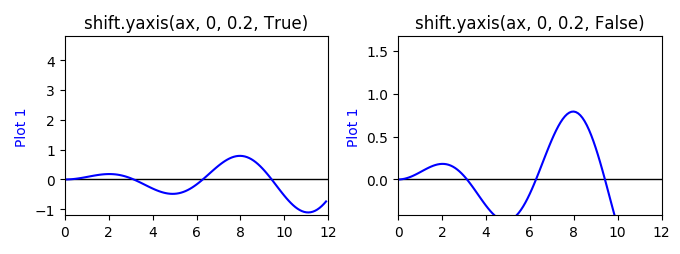
Argument 4: Shifting method (expand)
The last argument of shift.yaxis() (expand) toggle the origin shift method.
When expand = True, the plotting range is adjusted without reducing plotting range, otherwise, the plotting range is simply shifted:
The mathematical details are explained here. \(o\) and \(p\) are the given origin and relative position, respectively. And, \(y_b\) and \(y_t\) are the initial values of bottom and top of the axis. First, we calculate the relative position of the origin which represented by \(\bar{o}\):
When expand = True, the new values of bottom and top, \(y'_b\) and \(y'_t\), are calculated to satisfy the condition \(\bar{o} = p\).
When \(\bar{o} > p\):
When \(\bar{o} < p\):
When expand = False, the plotting range is simply shifted:
Shift x axis
shift.xaxis() adjust the plotting range of x axis.
The usage is same as y axis.