Align module usage
mpl_axes_aligner.align adjust the plotting range of two matplotlib axes to align their origins with the given position.
align.xaxes()for x-axesalign.yaxes()for y-axes
Align two y axes
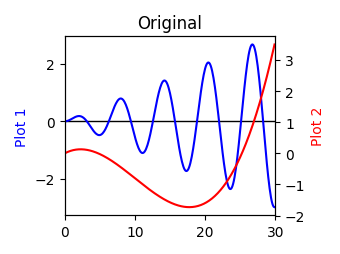
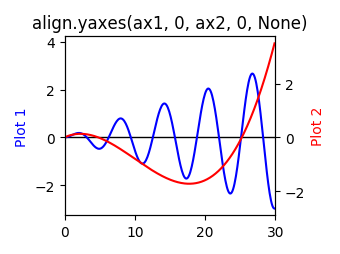
In this section, align.yaxes() is demonstrated by using the following plot:
import numpy as np
import matplotlib.pyplot as plt

x = np.arange(0.0, 30, 0.1)
y1 = 0.1 * x * np.sin(x)
y2 = 0.001*x**3 - 0.03*x**2 + 0.12*x

fig = plt.figure()
ax1 = fig.add_subplot(111)
ax2 = ax1.twinx()

ax1.plot(x, y1, color='blue', label='plot 1')
ax2.plot(x, y2, color='red', label='plot 2')
ax1.hlines(y=0, xmin=0, xmax=30, linewidth=1)

ax1.set_ylabel('Plot 1', color='blue')
ax2.set_ylabel('Plot 2', color='red')
ax1.set_xlim(0.0, 30.0)

plt.tight_layout()
plt.show()
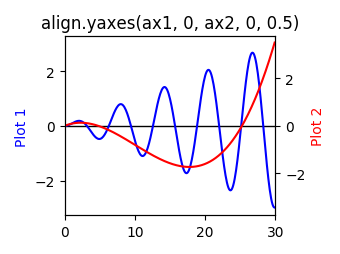
When you want to align y = 0 point of left and right y axes, use align.yaxes():
import numpy as np
import matplotlib.pyplot as plt
from mpl_axes_aligner import align

x = np.arange(0.0, 30, 0.1)
y1 = 0.1 * x * np.sin(x)
y2 = 0.001*x**3 - 0.03*x**2 + 0.12*x

fig = plt.figure()
ax1 = fig.add_subplot(111)
ax2 = ax1.twinx()

ax1.plot(x, y1, color='blue', label='plot 1')
ax2.plot(x, y2, color='red', label='plot 2')
ax1.hlines(y=0, xmin=0, xmax=30, linewidth=1)

ax1.set_ylabel('Plot 1', color='blue')
ax2.set_ylabel('Plot 2', color='red')
ax1.set_xlim(0.0, 30.0)

# Adjust the plotting range of two y axes
org1 = 0.0  # Origin of first axis
org2 = 0.0  # Origin of second axis
pos = 0.5  # Position the two origins are aligned
align.yaxes(ax1, org1, ax2, org2, pos)

plt.tight_layout()
plt.show()
shift.yaxis() is called in align.yaxes().
The argument expand is always True (Argument 4: Shifting method (expand)).
Argumetns 1 and 3: Axes (ax1 and ax2)
The first and third arguments of align.yaxes() (ax1 and ax2) are the matplotlib.axes.Axes objects which you want to change.
Argumetns 2 and 4: Origins (org1 and org2)
The second and fourth arguments of align.yaxes() (org1 and org2) are the origins which you want to align.
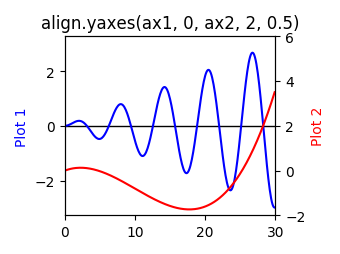
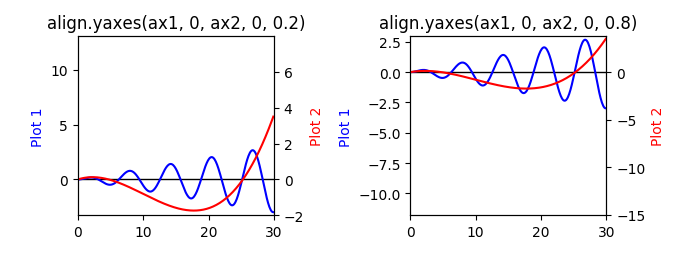
Argument 5: Relative position (pos)
The last argument of align.yaxes() (pos) is the relative position which the two origins are aligned.
pos should satisfy the condition \(0 < pos < 1\) (See also Argument 3: Relative position (pos)).
pos is optional argument, therefore, when pos is None, the two origins are aligned with the middle of them.
Align two x axes
align.xaxes() adjust the plotting range of two x axes.
The usage is same as y axes.